Graph Data Science With Networkx
In this article, I will explain the graph theory used in data science projects. We will use the networkx library in python for this.
What is the graph theory? What is it used for?
Graph theory is a discipline based on structures represented by nodes called graphs and the edges connecting them. Graph is a data structure consisting of nodes (nodes) and connections (edges) between these nodes. The graph class provides a set of features and functions for creating, manipulating, and analyzing graphs. These functions can be used for operations such as analyzing the structure of a graph, applying algorithms such as the shortest path algorithm, drawing the graph, or manipulating data on the graph.
How to use?
First we need to install the required library.
pip3 install networkx
We can create an empty graph.
import networkx as nx
G = nx.Graph()
We have an empty graph named G. We can use many self-defined methods with this graph object. Now let’s add our nodes. In this example, I will denote our nodes with one letter each.
import networkx as nx
G = nx.Graph()
G.add_node('A')                # We can add nodes one by one.
G.add_nodes_from(['B','C'])    # We can also get the nodes from an array.
Let’s add our connections.
import networkx as nx
G = nx.Graph()
G.add_node('A')
G.add_nodes_from(['B','C'])

G.add_edge('A','B')
G.add_edges_from([('B','C'),('A','C')])
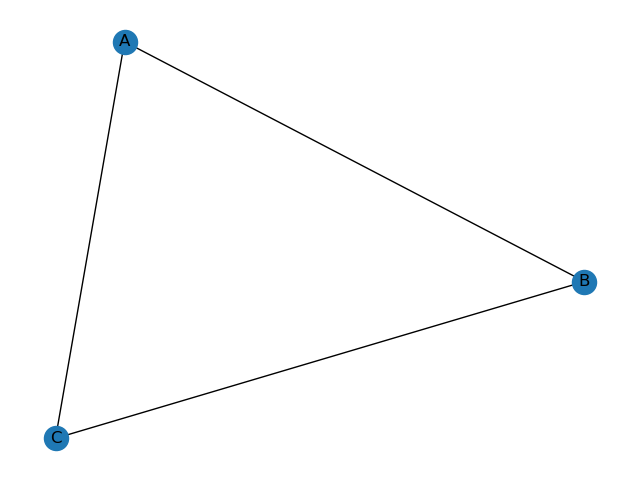
Let’s plot the graph we created using the matplotlib library.
import networkx as nx
import matplotlib.pyplot as plt

G = nx.Graph()
G.add_node('A')
G.add_nodes_from(['B','C'])

G.add_edge('A','B')
G.add_edges_from([('B','C'),('A','C')])

nx.draw(G, with_labels=True)
plt.show()
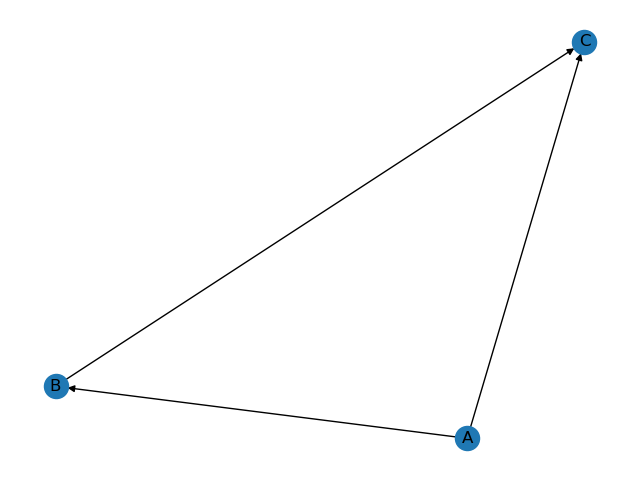
If you want to use a directional graph instead of an undirected graph, the output will be:
import networkx as nx
import matplotlib.pyplot as plt

G = nx.DiGraph()
G.add_node('A')
G.add_nodes_from(['B','C'])

G.add_edge('A','B')
G.add_edges_from([('B','C'),('A','C')])

nx.draw(G, with_labels=True)
plt.show()
The following functions may be useful for you.
print(nx.find_cores(G)) # shows the nodes and how many connections the nodes have in dictionary type.
print(list(G.nodes())) # gives the nodes as a list.
print(list(G.edges())) # gives links in a list.
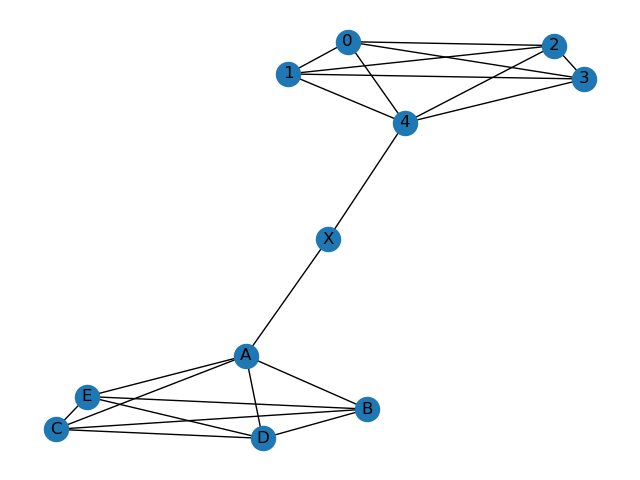
Also inspect the example below to create a new graph by combining the graphs.
import networkx as nx
import matplotlib.pyplot as plt

G1 = nx.complete_graph(5) # Creates a graph with 5 nodes.
G2 = nx.complete_graph(5)
G2 = nx.relabel_nodes(G2, {0: 'A', 1: 'B', 2: 'C', 3: 'D', 4: 'E'}) # We are changing the node names.
G_connector = nx.from_edgelist([(4, 'X'), ('X','A')])

G = nx.compose_all([G1, G2, G_connector]) # Creates a new graph by combining all given graphs.

nx.draw(G, with_labels=True)
plt.show()